Adult BMI Calculator
A free adult BMI calculator with an age and sex option, a body fat estimate, and the healthy weight range for your height. Enter your details once and see where you land. The adult healthy BMI range is 18.5 to 24.9. The calculator uses the standard WHO formula.
Example BMI
23.1
Healthy range
Example BMI
23.1
Healthy range
- Underweight< 18.5
- Healthy range18.5–<25
- Overweight25–<30
- Obesity range≥ 30
BMI compares weight with height. It does not distinguish muscle from fat.
Body fat estimate uses the Deurenberg formula. It's a rough guide, not a DEXA scan. Individual results vary with muscle mass, frame size, and ethnicity. For a photo-based estimate, try the AI Body Fat Estimator.
How the Adult BMI Calculator Works
- 1
Enter your height and weight
Pick metric or imperial at the top. Enter height in centimeters, inches, or feet and inches. Enter weight in pounds or kilograms. The calculator uses the standard BMI formula: weight in kilograms divided by height in meters squared.
- 2
Add your age and sex
Age and sex don't change the BMI math. They're used for two things. The body fat estimate (Deurenberg formula needs both). The age-adjusted interpretation underneath your result. A BMI of 26 means something different at 28 than it does at 68.
- 3
Read your BMI and category
Your result shows your BMI number, your WHO category, your healthy weight range for your height, your estimated body fat percentage, and your BMI Prime (a ratio to the 25 upper limit). The arc gauge shows where your number sits on the full scale.
Same BMI, Different Body
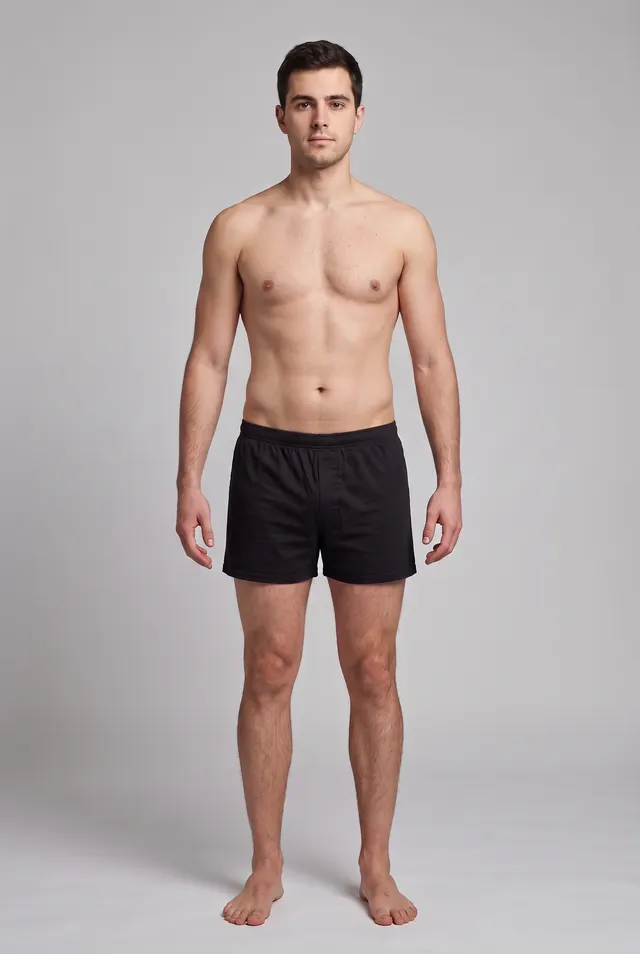
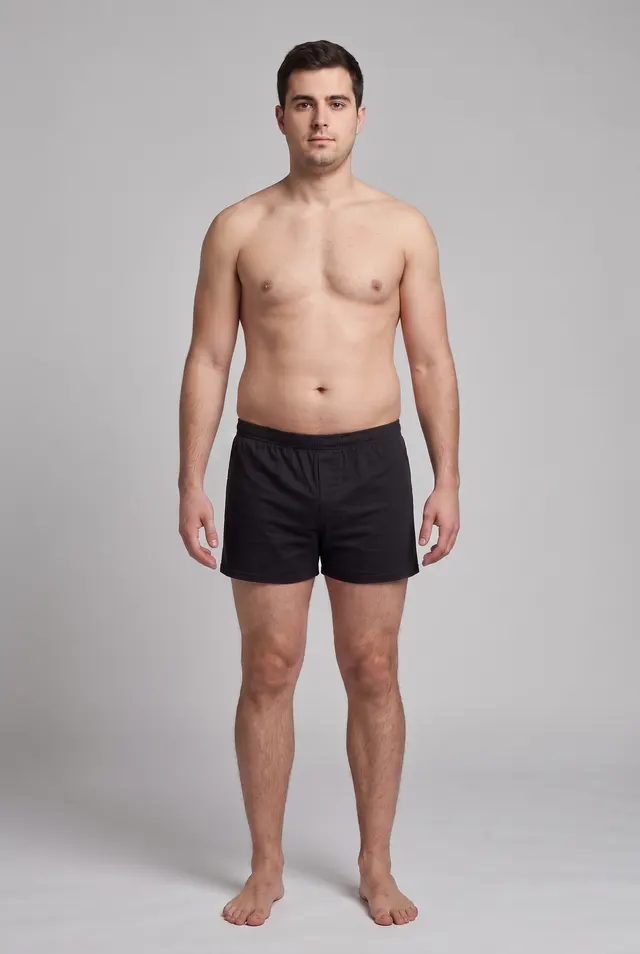
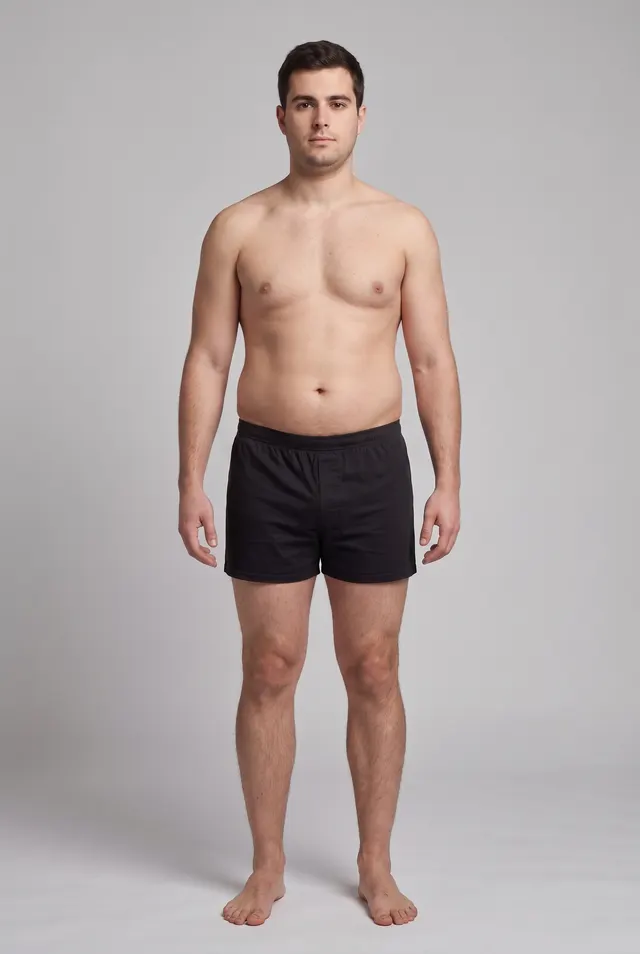
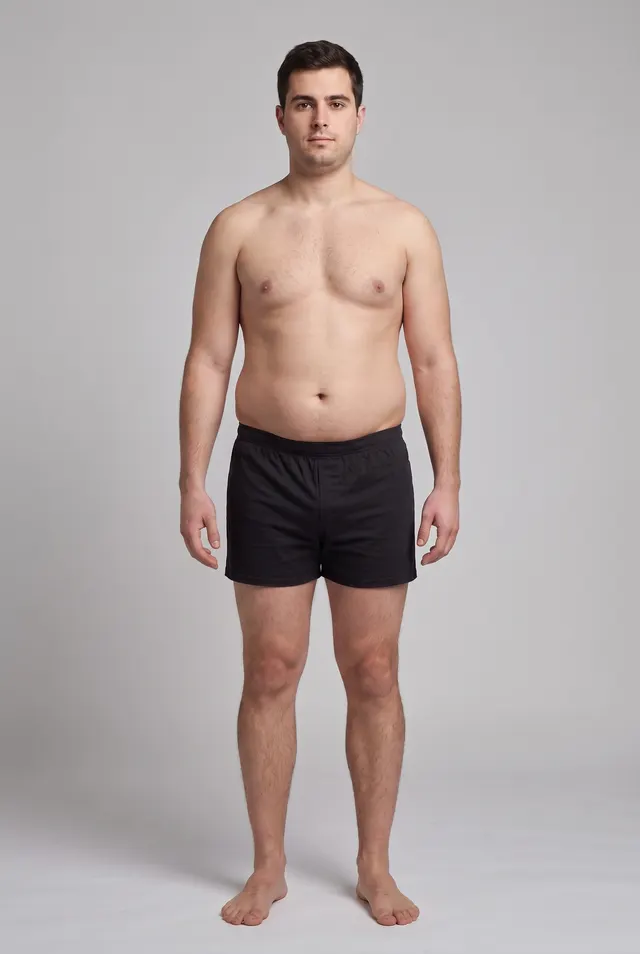
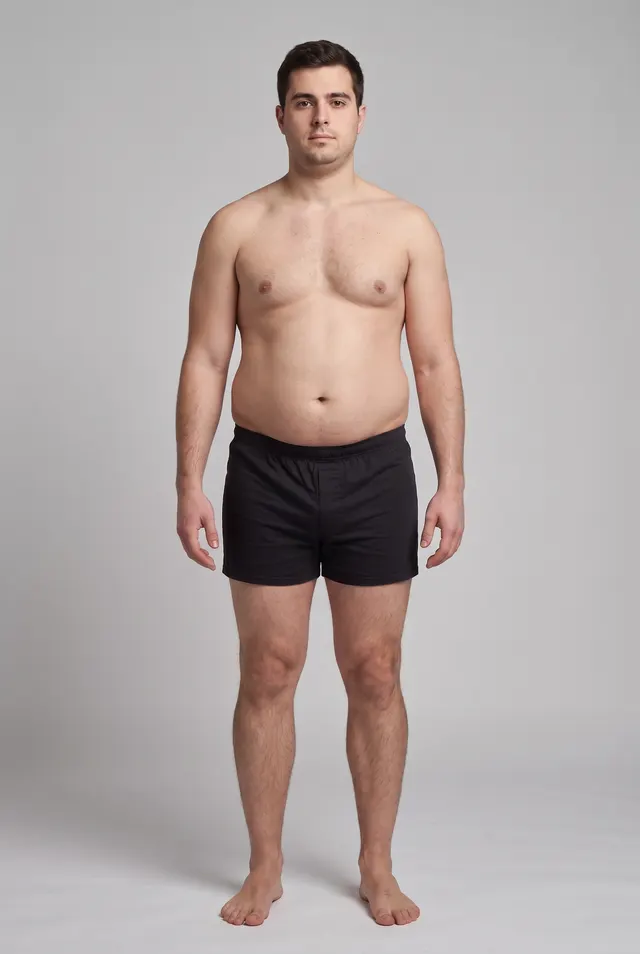
BMI is a number. Body composition is a reality. Two people with the same BMI can look completely different and carry very different health risks.
A 5'10" lifter at 195 pounds shows a BMI of 28 and gets labeled "overweight." He's at 14% body fat with real muscle. A 5'10" desk worker at 195 pounds has the same BMI. He's at 28% body fat with a soft midsection. Same number, different bodies, different risk profiles.
Three things BMI doesn't see. Muscle versus fat (the lifter problem). Where the fat sits (belly fat is more dangerous than hip fat at the same BMI). Frame size and ethnicity (WHO recommends a lower overweight threshold of 23 for Asian populations). BMI is a quick screen, not a diagnosis. Pair it with a body fat estimate, a waist measurement, or progress photos to see what the number misses. That's why this page shows a body fat estimate alongside your BMI, and why progress photos remain the honest way to track change.
To see the shape behind a given BMI, try the Body Visualizer, or the 3D Body Visualizer for a rotatable view. If the lifter-versus-desk-worker gap in the example above is where you want to be, our guide on how long body recomposition takes covers the realistic timeline.
Adult BMI Categories
The WHO uses six BMI categories for adults 20 and older. Same categories for men and women.
| BMI | Category |
|---|---|
| Below 18.5 | Underweight |
| 18.5 to 24.9 | Healthy weight |
| 25.0 to 29.9 | Overweight |
| 30.0 to 34.9 | Obesity class I |
| 35.0 to 39.9 | Obesity class II |
| 40.0 or above | Obesity class III (severe obesity) |
WHO BMI Ranges for Adults
These ranges come from the World Health Organization and are used by the CDC, NIH, and most national health authorities. Asian and South Asian populations use lower thresholds (overweight at 23, obese at 27.5) because of higher cardiometabolic risk at lower BMIs. The CDC covers this exception here.
What Counts as a Healthy BMI?
A BMI between 18.5 and 24.9 is healthy. Inside that range, 20 to 22 is the midpoint most often linked to the lowest all-cause mortality in large studies. A BMI of 23 is good. A BMI of 17 is underweight and worth checking with a doctor.
What BMI Is Overweight, Obese, or Morbidly Obese?
Overweight starts at 25. Obesity starts at 30. Morbid obesity (also called class III or severe obesity) starts at 40. The CDC links higher classes to higher risks of type 2 diabetes, hypertension, and heart disease.
Is BMI Different for Men and Women?
No. Same formula, same range. Women naturally carry more essential fat than men at the same BMI, which is why BMI is a rough screen, not a precise body-composition measure. For lifters, the FFMI calculator is a better fit.
Healthy Weight for Your Height
Find your height and see the pound range that keeps your BMI inside the healthy band of 18.5 to 24.9.
Weight Chart in Pounds (Imperial)
| Height | Healthy range (lb) | Overweight at | Obese at |
|---|---|---|---|
| 5'0" | 95–128 | 129 | 154 |
| 5'1" | 98–132 | 133 | 159 |
| 5'2" | 101–136 | 137 | 164 |
| 5'3" | 105–141 | 142 | 170 |
| 5'4" | 108–145 | 146 | 175 |
| 5'5" | 112–150 | 151 | 180 |
| 5'6" | 115–155 | 156 | 186 |
| 5'7" | 118–159 | 160 | 191 |
| 5'8" | 122–164 | 165 | 198 |
| 5'9" | 125–169 | 170 | 203 |
| 5'10" | 129–174 | 175 | 209 |
| 5'11" | 133–179 | 180 | 215 |
| 6'0" | 137–184 | 185 | 221 |
| 6'1" | 141–189 | 190 | 227 |
| 6'2" | 145–195 | 196 | 234 |
| 6'3" | 149–200 | 201 | 240 |
| 6'4" | 152–205 | 206 | 247 |
| 6'5" | 156–211 | 212 | 253 |
| 6'6" | 160–216 | 217 | 260 |
| 6'7" | 165–222 | 223 | 267 |
| 6'8" | 169–228 | 229 | 274 |
Weight Chart in Kilograms (Metric)
| Height | Healthy range (kg) | Overweight at | Obese at |
|---|---|---|---|
| 150 cm | 42–56 | 57 | 68 |
| 155 cm | 45–60 | 61 | 72 |
| 160 cm | 48–64 | 65 | 77 |
| 165 cm | 51–68 | 69 | 82 |
| 170 cm | 54–72 | 73 | 87 |
| 175 cm | 57–76 | 77 | 92 |
| 180 cm | 60–81 | 82 | 97 |
| 185 cm | 64–85 | 86 | 103 |
| 190 cm | 67–90 | 91 | 108 |
| 195 cm | 71–95 | 96 | 114 |
| 200 cm | 74–100 | 101 | 120 |
| 203 cm | 77–103 | 104 | 124 |
Is 200 Pounds Overweight? Common Weight Questions
Is 200 pounds overweight? Depends on height. At 5'10", 200 lb is a BMI of 28.7, which is overweight. At 6'4", 200 lb is 24.4, which is healthy. Check the chart above for your exact height.
How much should a 6-foot man weigh? For 6'0", the healthy range is 137 to 184 lb (62 to 83 kg). Most men settle between 160 and 180 depending on muscle mass.
How much should I weigh at 5'4"? For 5'4", the healthy range is 108 to 145 lb (49 to 66 kg). The midpoint is around 127 lb.
Is 170 pounds overweight? It depends on height. At 5'6", 170 lb is a BMI of 27.4 (overweight). At 5'10", it's 24.4 (healthy). At 6'1", it's 22.4 (healthy middle).
Is 300 pounds obese? Yes, for anyone under 7 feet tall. At 5'10", 300 lb is BMI 43 (class III obesity). At 6'0", it's 40.7.
Adult BMI by Age
BMI thresholds are the same at every age. What a given BMI means for your health shifts with each decade.
Young Adult BMI (20s and 30s)
Peak muscle mass and metabolic rate. The WHO range applies cleanly. Weight changes usually reflect behavior, not biology. If your BMI is in the healthy range, you're probably fine.
Middle-Aged BMI (40s and 50s)
Muscle loss (sarcopenia) runs roughly 3 to 8% per decade after 30. The same BMI as a 25-year-old means slightly more body fat and less lean mass. Women hit perimenopause and often gain weight at the midsection. Resistance training becomes critical.
Senior BMI (60+)
Research on adults over 65 suggests a slightly higher BMI of 25 to 27 may be protective. Small reserves of weight help offset age-related muscle loss (sarcopenia) and recovery from illness. Being "overweight" at 68 is not the same as being overweight at 28.
How BMI Compares to Other Measurements
BMI is one data point. Combine it with a body fat estimate, a waist measurement, or FFMI for a more complete picture.
| Measure | What it tells you | Best for | Weakness |
|---|---|---|---|
| BMI | Weight-to-height ratio | Quick screening, population studies | Doesn't separate muscle from fat |
| Body fat % | Composition | Fitness, body-comp goals | Harder to measure accurately |
| Waist-to-height ratio | Fat distribution | Metabolic risk | Doesn't capture total weight |
| FFMI | Lean mass relative to height | Lifters and athletes | Needs a body fat % input |
No single number tells the whole story. BMI is the fastest screen. Body fat percentage is the honest picture. Waist-to-height ratio catches the fat that matters most for heart health. FFMI is what muscular people actually care about.
For a photo-based body fat reading, try the AI Body Fat Estimator, or our guide on how to measure body fat if you want to compare methods first. For lean mass, use the FFMI calculator, or rate your overall build with the Physique Rater. For long-term change, progress photos are more useful than any single number.
Frequently Asked Questions
A normal (healthy) BMI for adults is between 18.5 and 24.9, regardless of sex. Below 18.5 is underweight. 25 to 29.9 is overweight. 30 and above is obese. These ranges come from the WHO and apply to adults 20 and older.
More Body Tracker Tools
Get your body fat from a photo.
Upload one photo and see your body fat percentage.