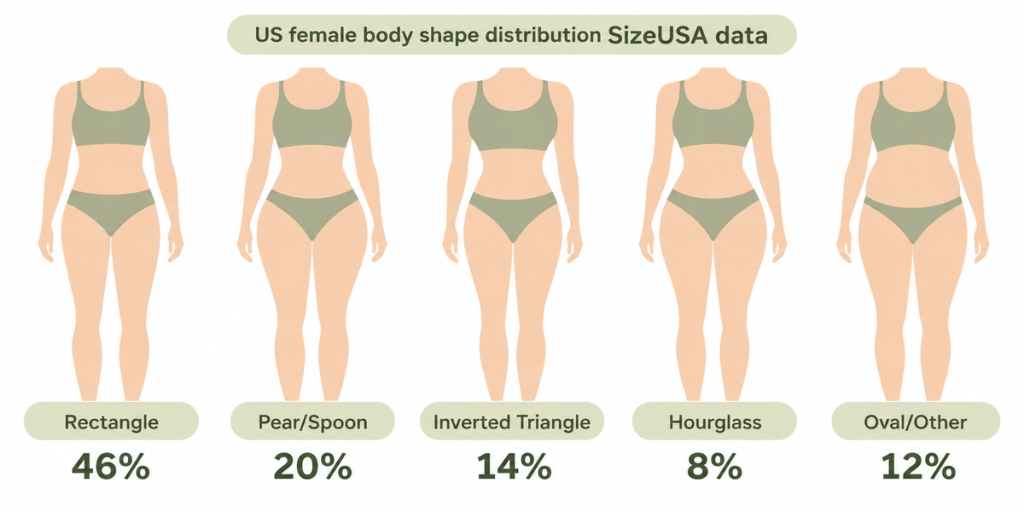
There's no single set of ideal body measurements for women. The famous 36-24-36 figure is a 1960s pop culture ideal that roughly 8 percent of US women actually have per the SizeUSA scan study. What the research supports is frame-relative: waist under half your height (waist-to-height ratio below 0.5) per NICE 2025 guidance, waist under 35 inches per NHLBI thresholds, and healthy "ideal" measurements that depend on your height, age, and body shape. Not a one-size-fits-all chart.
| Section (linked) | Section Type | What You’ll Find |
|---|---|---|
| Is There Really an “Ideal”? | Framing | Why fixed-number charts fail and what proportion relationships actually tell you |
| Average Body Measurements for US Women | Reference Table | NHANES 2015-2018 baseline: height, weight, waist, BMI for US women 20+ |
| Where 36-24-36 Came From | Explainer | Brick House, pin-up history, Evelyn Ay, and why Singh’s 0.7 WHR research doesn’t hold up |
| Ideal Waist Size by Height | Reference | Chart Full table from 5'0" to 6'0" with your healthy band and increased-risk threshold |
| The 3 Proportions That Matter | Deep Dive | Waist-to-height, waist-to-hip, shoulder-to-hip what each one actually tells you |
| X-Y-Z Measurement Sets Decoded | Quick Reference | What 36-24-36, 32-22-32, 36-26-36, 34-24-34 and other number sets actually mean |
| Measurements by Age and Life Stage | Explainer | How cycle, pregnancy, postpartum and menopause shift what’s normal for you |
| How to Measure Your Body at Home | How-To | Step-by-step tape protocol with 6 landmarks, using the WHO-standard waist position |
| How to Track Progress Honestly | Action Plan | Monthly tape plus photos every 2-4 weeks: the cadence that reveals signal over noise |
| FAQ | Quick Answers | 36-24-36 reality, 5'4" and 5'2" waist targets, Marilyn Monroe, cycle fluctuation, and more |
| The Bottom Line | Summary | The 2 numbers that actually predict health, and how to track them over time |
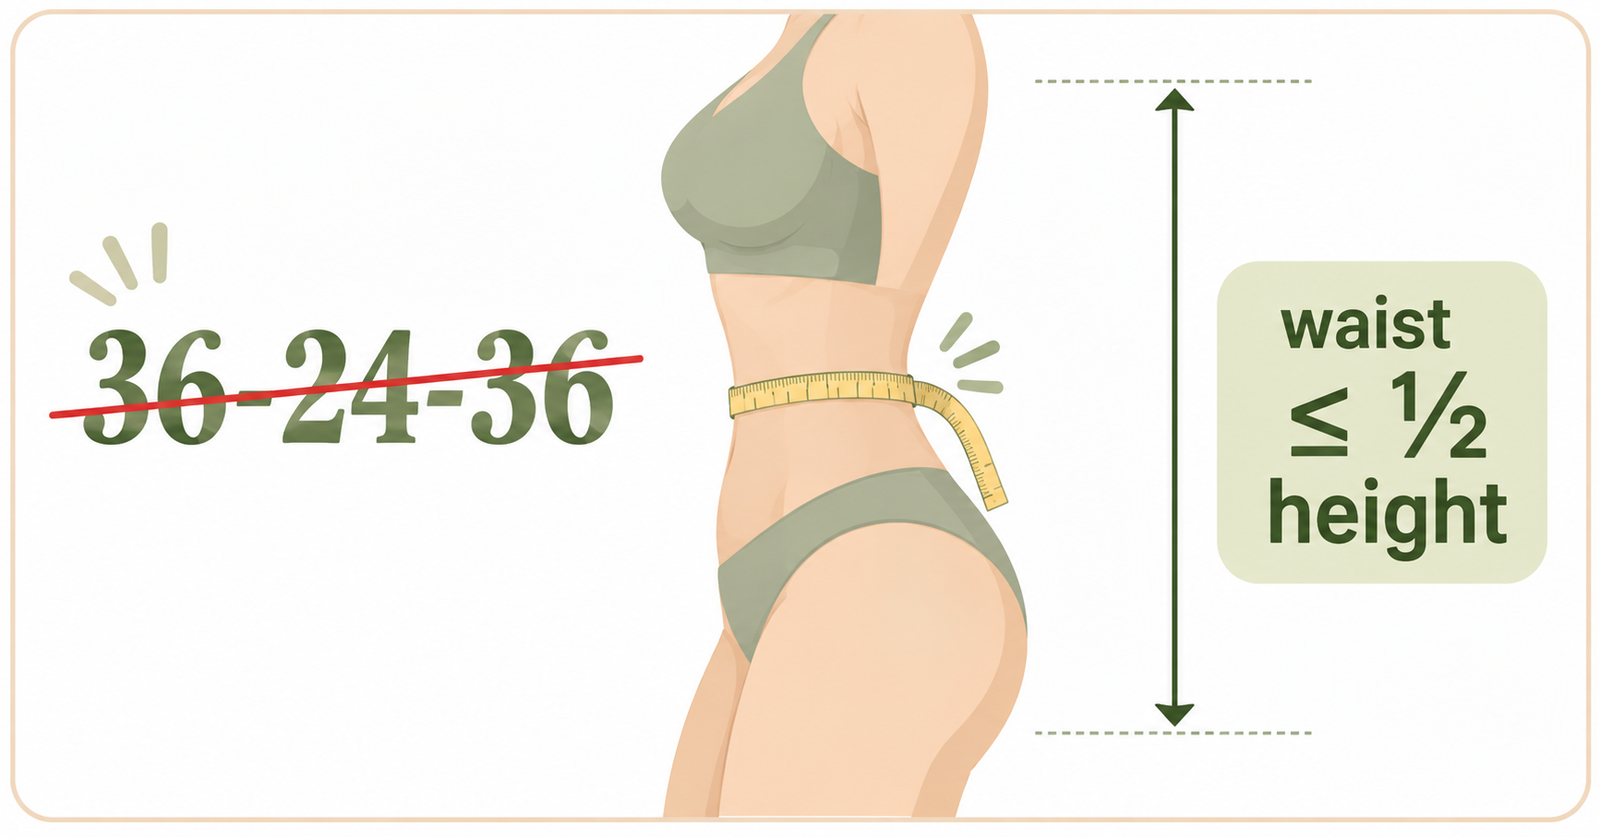
The average US woman has a 38.7-inch waist. The 36-24-36 "ideal" asks for 24. That's a nearly 15-inch gap between the chart and reality, and it's been there for decades. The three numbers everyone still quotes came from 1950s pageant stages, not from any health data.
Our team spends most days looking at user progress-photo timelines inside Body Tracker. The pattern we see over and over isn't that people need a "perfect" measurement. It's that they need to know what's actually worth tracking, and how to see real change honestly. That's what this guide is for. Every number is sourced. Every practical takeaway is something we've watched play out in thousands of real transformation timelines.
Is there really an "ideal" set of body measurements for women?
Not as a fixed chart. A 24-inch waist means very different things at 5'1" and at 5'10". Bust and hip measurements are mostly driven by skeletal width and genetic fat distribution, both of which vary widely between perfectly healthy women. Any chart that hands every reader the same three numbers is describing one body type and grading everyone else against it.
What does carry real information is a handful of proportion relationships. Waist-to-height tracks metabolic risk. Waist-to-hip describes fat distribution. Shoulder-to-hip describes shape. A celebrity's tape measurements don't.
What are the average body measurements for US women?
The most recent finalized NHANES data (2015-2018), collected directly by trained examiners rather than self-reported, gives the honest baseline for women aged 20 and over:
| Measurement | US average (women 20+) |
|---|---|
| Height | 5 ft 3.5 in (161.3 cm) |
| Weight | 170.8 lb (77.5 kg) |
| Waist circumference | 38.7 in (98.4 cm) |
| BMI | 29.6 kg/m² |
Hip averages are commonly cited in the 41-42 inch range. Notice the gap: the "ideal" 36-24-36 waist is nearly 15 inches smaller than the measured average. That's the whole case against 36-24-36 as a benchmark. It describes almost nobody.
What we see in Body Tracker user timelines matches that reality. The people who get stuck in their transformation aren't the ones with "wrong" numbers. They're usually the ones chasing a chart instead of tracking their own trend.
Where did 36-24-36 come from (and is it still relevant)?
36-24-36 is a pop culture artifact, not a health standard. It was popularized through pageant publicity, pin-up art, and 1960s advertising, then cemented in music by the Commodores' 1977 hit "Brick House" ("36-24-36, what a winning hand") and Sir Mix-A-Lot's 1992 "Baby Got Back." Lionel Richie has said the Brick House title plays on the expression "built like a brick shithouse," meaning a strongly built woman. Not a scientific target.
The number was never a population average. 1954 Miss America Evelyn Ay actually measured 37-24-36, which is close but not even that. The "exactly 36-24-36" figure is a slogan.
The companion claim that a 0.7 waist-to-hip ratio is universally ideal traces to Devendra Singh's 1993 paper in the Journal of Personality and Social Psychology, which analyzed Miss America winners and Playboy centerfolds. That finding has been seriously challenged:
- Freese and Meland (2002), titled "Seven Tenths Incorrect," found greater variation in the same datasets than Singh reported and showed the WHR center was below 0.7 and shifted over time.
- Bovet and Raymond (2015) tracked women judged beautiful in Western art across 2,500 years and found the preferred WHR has shifted substantially across history.
- Jeanne Bovet's 2019 systematic review (104 studies) calls the universal-0.7 narrative "just-so storytelling" and concludes preference varies by context and population.
Clinically, the waist-to-hip number that matters is different and more forgiving. The WHO flags ratios above 0.85 in women as elevated health risk. Below that, your WHR is a shape descriptor, not a problem.
Ideal waist size by height: the chart that actually scales
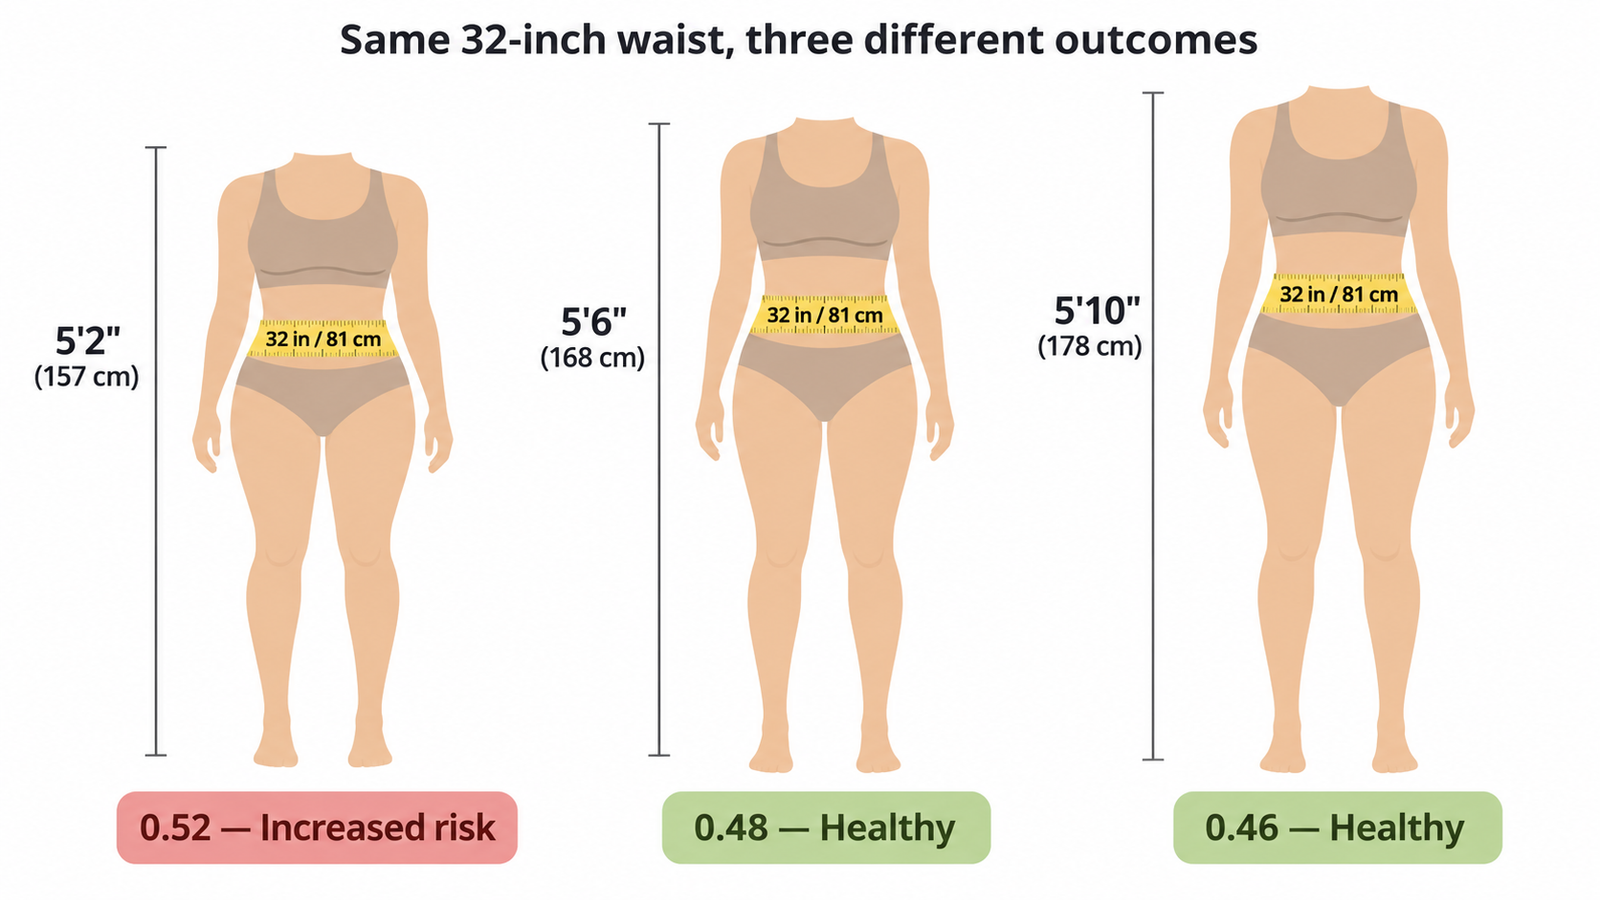
Built on one modern health guideline: your waist should be less than half your height. The UK's National Institute for Health and Care Excellence formally adopted this threshold in January 2025 (NICE guideline NG246), after decades of research showing waist-to-height ratio outperforms BMI as a predictor of cardiometabolic risk.
| Height | Healthy waist (WHtR < 0.5) | Increased risk (WHtR 0.5-0.59) |
|---|---|---|
| 5'0" (152 cm) | under 30 in / 76 cm | 30-36 in / 76-90 cm |
| 5'2" (157 cm) | under 31 in / 79 cm | 31-37 in / 79-93 cm |
| 5'4" (163 cm) | under 32 in / 81 cm | 32-38 in / 81-96 cm |
| 5'6" (168 cm) | under 33 in / 84 cm | 33-39 in / 84-99 cm |
| 5'8" (173 cm) | under 34 in / 86 cm | 34-40 in / 86-102 cm |
| 5'10" (178 cm) | under 35 in / 89 cm | 35-42 in / 89-105 cm |
| 6'0" (183 cm) | under 36 in / 91 cm | 36-43 in / 91-108 cm |
The 3 proportions research says actually matter
1. Waist-to-height ratio (WHtR). Waist divided by height. Keep under 0.5. It's the strongest simple signal because waist circumference proxies visceral fat. The 2024 Lancet Commission on clinical obesity now recommends WHtR above 0.5 as a confirmation measure for diagnosing obesity, moving past BMI alone.
2. Waist-to-hip ratio (WHR). Waist divided by hip. Risk climbs above roughly 0.85 for women per WHO guidance. Below that, WHR mostly describes fat distribution, which is genetically influenced.
3. Shoulder-to-hip ratio. Purely descriptive of shape. Roughly equal lines read hourglass or athletic. Wider hips read pear. Wider shoulders read inverted triangle. Each is a healthy skeletal variation.
In practice, the Body Tracker users whose photos show the biggest visible change over three to six months are the ones focused on the first two: waist (through fat loss) and shoulder-hip balance (through resistance training). That matches what the research predicts. Everything else (a specific bust, a specific thigh circumference, 36-24-36) adds no information these three ratios don't already capture.
Female body shapes: which one are you?
The most cited US dataset is SizeUSA, a 3D body-scan survey of over 6,300 American women analyzed at North Carolina State University using the Female Figure Identification Technique for Apparel (FFIT). The population breakdown:
| Body shape | % of US women | Numeric definition |
|---|---|---|
| Rectangle | 46% | Bust, waist, hips within 5% of each other |
| Spoon / Pear | 20% | Hips more than 2 in wider than bust; defined waist |
| Inverted Triangle | 14% | Bust more than 3.6% larger than hips |
| Hourglass | 8% | Bust and hips within 1 in; waist 9+ in smaller |
| Other (oval, diamond, top/bottom hourglass) | 12% | Variants |
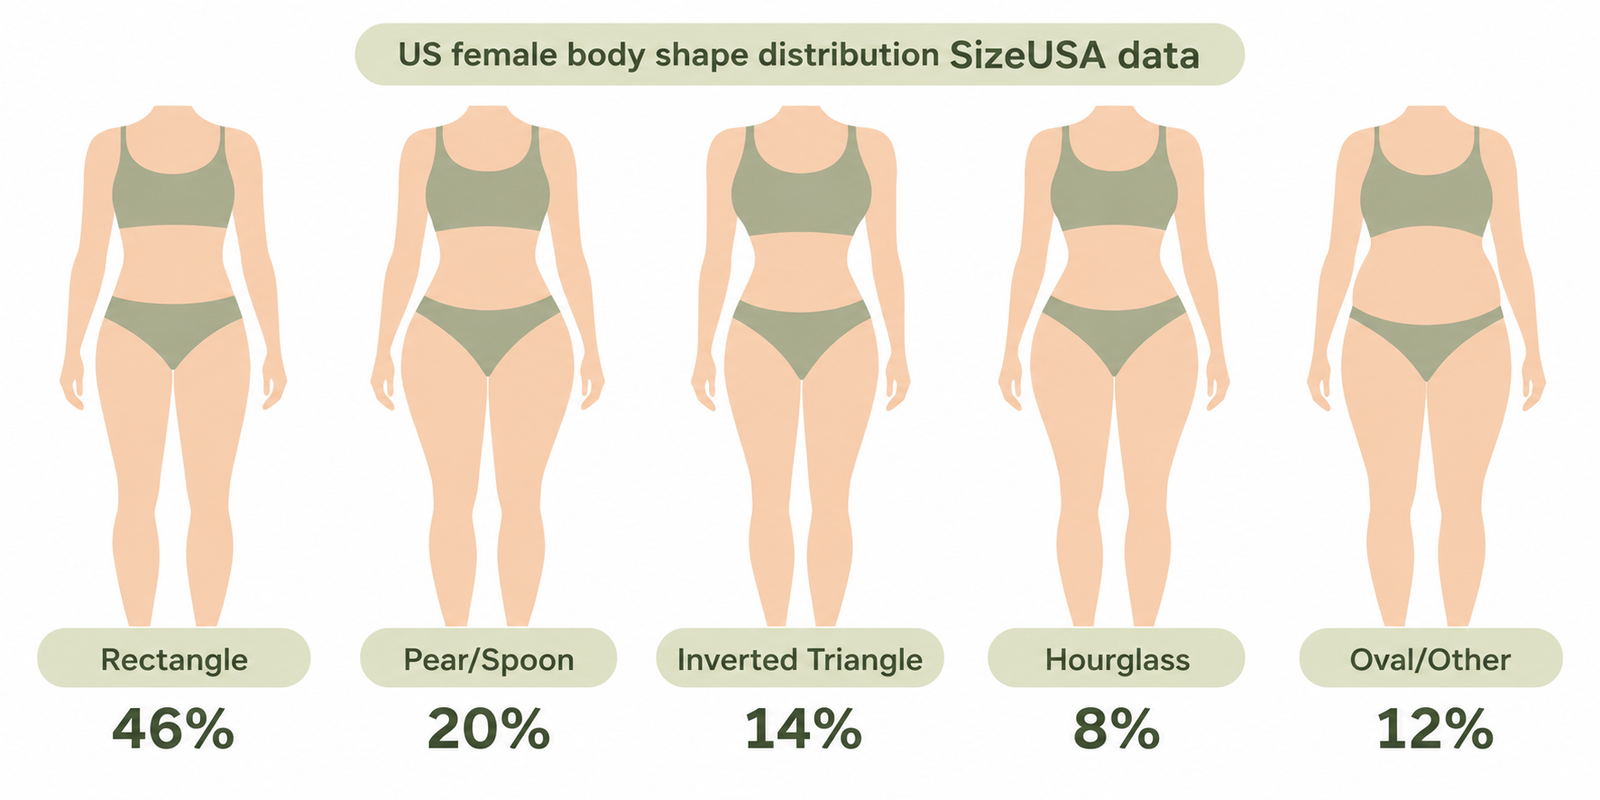
Only about 8 percent of US women have the hourglass figure the 1950s turned into the default. Most are rectangles. That's a healthy, normal shape, and one that gets almost no respect in fashion or fitness marketing.
One pattern we see repeatedly in Body Tracker user photos: people misidentify their own shape by one category. Shape reads more honestly in a side-by-side photo comparison than in a single tape measurement, which is why the Progress Photo Comparison tool is often the first thing users open before they ever measure themselves with a tape.
One honest caveat on the data: SizeUSA was collected in the early 2000s. It's still the best publicly available US body-scan dataset, but body composition trends have shifted since then. The distribution is directional, not a 2026 snapshot.
What do 32-22-32, 36-26-36, and other X-Y-Z figures mean?
- 36-24-36: 12-inch waist-to-bust/hip difference, classic hourglass.
- 36-26-36: 10-inch difference, hourglass-adjacent.
- 36-28-36: 8-inch difference, between hourglass and rectangle.
- 32-22-32: Smaller-framed hourglass.
- 34-24-34: Petite hourglass.
- 38-24-36: Top hourglass, bust-emphasized.
- 34-32-36: Spoon/pear with limited waist definition.
What matters for health isn't the three numbers but the ratios they imply. A 24-inch waist on a 5'10" frame is a waist-to-height ratio of 0.34, which sits below the healthy band and usually tracks with very low body weight.
How body measurements change with age and life stage
NHANES data shows mean BMI and waist circumference rise through middle age and then level off. For women aged 20-29, average BMI typically sits in the mid-to-upper 20s. By 50-59 it usually pushes near 30. Treating a 25-year-old's and a 55-year-old's "ideal" as identical ignores biology.
- Menstrual cycle: waist can fluctuate by an inch or two from water retention. Measure at the same cycle point.
- Pregnancy and postpartum: all three measurements shift significantly. Recovery takes 12+ months and may be permanent at the pelvic level, since the rib cage and pelvis can widen.
- Menopause: estrogen decline shifts fat storage toward the abdomen, which can raise WHR without actual weight gain.
Because baseline body composition shifts across decades, planning realistic goals for your current life stage matters more than hitting a chart written for someone 20 years younger. If you're setting a new target, the free Weight Loss Timeline tool projects a realistic goal date from your current starting point.
Clothing size vs. fitness vs. health measurements
Three different measurement sets people often confuse:
- Clothing fit: full bust, natural waist (narrowest point), hips (widest point of buttocks), inseam, shoulder width.
- Fitness tracking: navel waist, hips at widest, bust, thighs, arms, taken monthly under the same conditions.
- Health screening: waist at the iliac crest per WHO protocol, height, weight. Used for WHtR and WHR.
If your health waist and your clothing waist disagree, both are right. They measure different landmarks for different purposes.
How to measure your body accurately at home
Use a flexible fabric tape. Breathe out normally. Keep the tape snug but not compressed. Round to the nearest quarter inch.
- Bust: across the fullest part (usually the nipple line), arms relaxed.
- Natural waist: the narrowest point between ribs and hip bones, roughly half an inch to an inch above the navel.
- Health waist: midway between the lowest rib and the top of the hip bone (WHO protocol), used for WHtR and WHR.
- Hips: widest part of the buttocks, feet together.
- Mid-thigh: halfway between hip and knee.
- Upper arm: mid-bicep, arm relaxed.
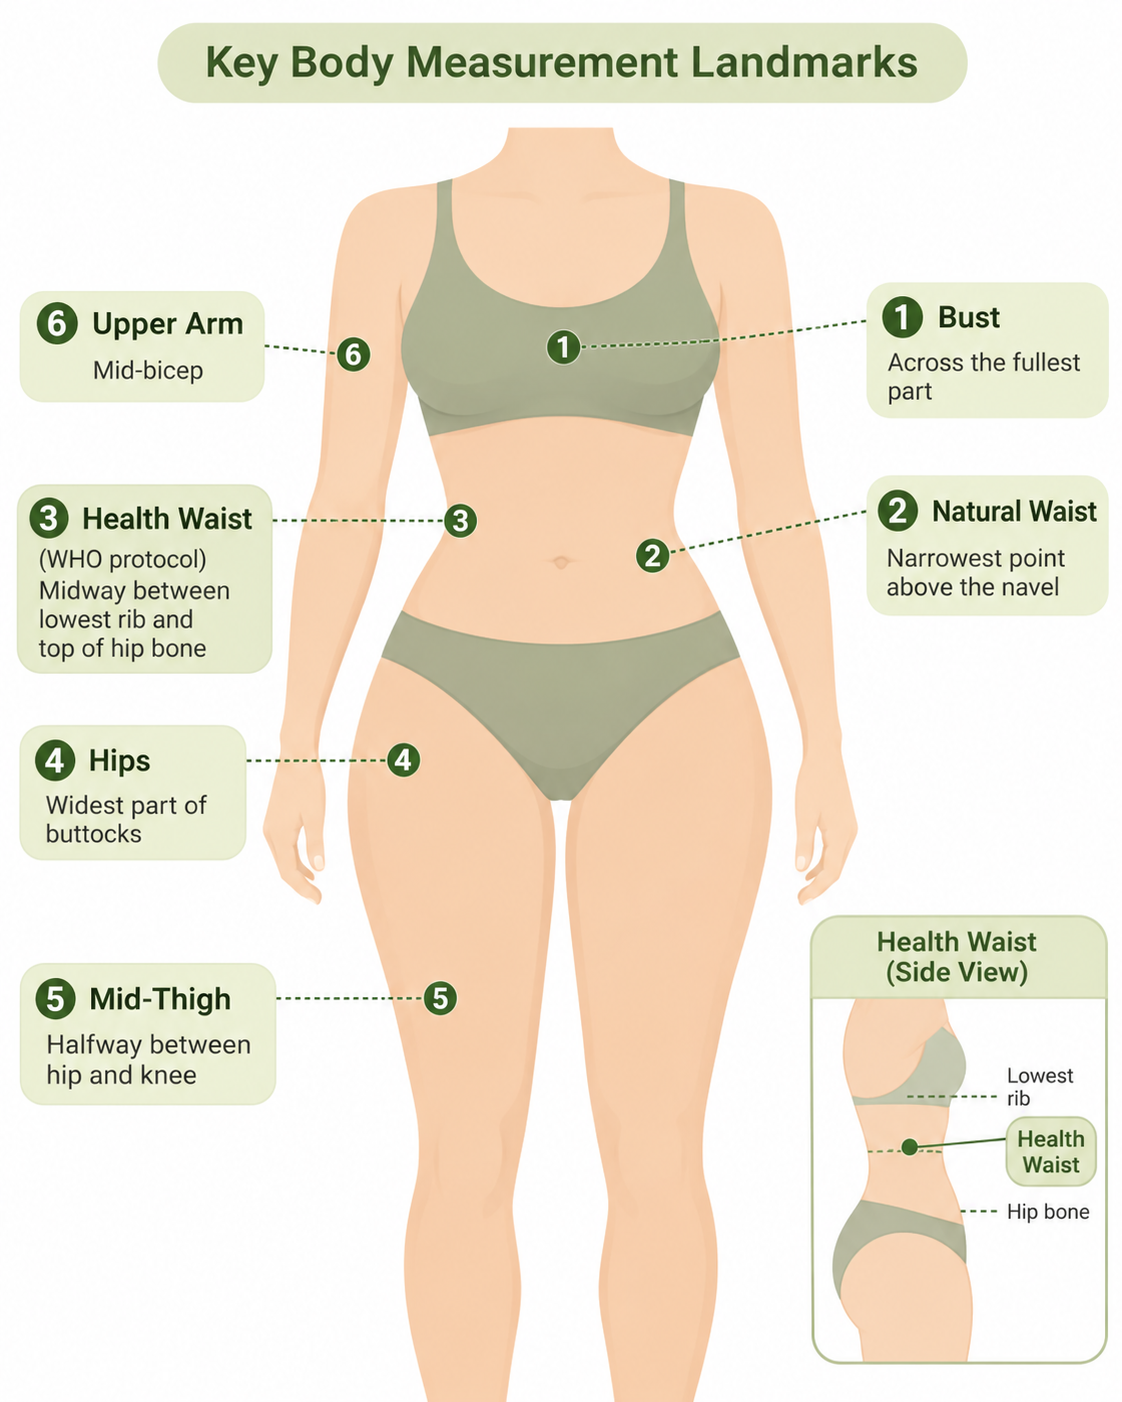
We built the self-timer and alignment grid in Body Tracker because hand-held progress photos vary too much month-to-month to compare honestly. The same principle applies to tape measurements: same landmark, same conditions, every time. Take the numbers once a month, in the morning, before eating, on the same cycle day where applicable. For a deeper dive on measurement cadence and photo timing, see our guide on how often to take progress photos.
What training can change, and what's set by your skeleton
Rib cage, pelvis width, and shoulder bone width are fixed once growth completes. No workout narrows a pelvis. If your hips measure wide because your iliac crests are wide, that's permanent, and it's also the structural foundation of your waist-to-hip ratio.
Soft tissue is trainable. Glute training adds to the hip line. Deltoid and upper-back training widens the shoulder line, which can rebalance a wider-hipped frame. Fat loss shrinks the waist faster than any other lever, and it improves both waist-to-height and waist-to-hip ratios at the same time. Muscle changes where the inches sit. Body fat changes how many there are.
For a wider look at non-scale progress signals that go beyond tape measurements, see our guide on how to track fitness progress beyond the scale.
How to track your measurements for real progress
A single reading tells you almost nothing. A trend over months tells you a lot. The cadence that works best in practice, from what we see across Body Tracker users who stick with their transformations, is monthly tape plus photos every two to four weeks. Weekly tape just surfaces cycle and meal-timing noise. Monthly tape plus biweekly photos is where the actual signal shows up.
Combine three signals:
- Tape measurements at the fixed points above, taken monthly.
- Progress photos from the same angle, lighting, and distance every two to four weeks.
- Scale weight as a background signal only. For why the scale is a poor primary metric, see progress photos vs the scale.
Body Tracker was built for this. It aligns your progress photos automatically, builds a before-and-after slider across any timeframe, and keeps every photo on-device. For a body fat estimate from a single photo, the free AI Body Fat Estimator runs in the browser. If you want to compare options before settling on a tracking tool, our review of the best apps for progress photos covers what to look for.
Frequently Asked Questions
There's no single set. The useful frame-relative targets are waist-to-height ratio under 0.5 (NICE 2025), waist under 35 inches (NHLBI), and waist-to-hip ratio under 0.85 (WHO). Specific bust and hip inches are cosmetic preference, not health metrics.
No. 36-24-36 is a 1960s-70s pop culture ideal popularized by advertising and songs like Brick House and Baby Got Back. Only about 8 percent of US women have hourglass proportions per the SizeUSA study, and the average US woman has a 38.7-inch waist. Modern health guidance focuses on ratios, not fixed inches.
Under 32 inches (81 cm), based on the "waist less than half your height" guideline from NICE NG246 (January 2025). Up to 38 inches sits in the increased-risk band.
Under 0.85 per WHO guidance. The "0.7 is attractive" figure comes from older attractiveness research that's been seriously challenged. Bovet's 2019 systematic review of 104 studies calls the universal-0.7 finding "just-so storytelling."
Under 0.5. The NICE NG246 rule (January 2025) is to keep your waist less than half your height. The 2024 Lancet Commission on clinical obesity recommends WHtR above 0.5 as a confirmation measure for diagnosing obesity.
The rectangle. The SizeUSA 3D body-scan study of over 6,300 US women found roughly 46 percent rectangle, 20 percent spoon/pear, 14 percent inverted triangle, and only about 8 percent hourglass.
Waist under 31 inches (79 cm) per the waist-to-height guideline. There's no evidence-based target for bust or hip inches specifically.
Soft tissue, yes. The skeleton, no. Rib cage, pelvis, and shoulder bone widths are set after growth. Training builds glutes, delts, and back, which shifts the visible shoulder-hip-waist balance. Fat loss shrinks the waist. Those two levers drive most adult proportion change.
Her measurements are disputed across sources. They're commonly reported as 35-22-35, 36-24-34, or 37-23-36 depending on year and source. There's no reliable primary tape measurement. 36-24-36 is cultural shorthand, not a verified biography.
Cycle-related fluid retention can shift waist circumference by an inch or two, usually peaking just before menstruation. Measure on the same cycle day each month for consistent tracking.
Bottom line
Stop measuring yourself against a chart written for a 1960s pin-up. The numbers that actually predict health are your waist compared to your height (under half) and your waist compared to your hips (under 0.85).
Your "ideal measurements" are whatever those ratios look like when your waist sits in the healthy band for your height. Track the trend, not the single reading. Tape, photos, and a scale give you three honest signals. That beats any celebrity chart ever printed.
About the author
Salah Eddine is a content writer at Body Tracker. The product team behind this guide has spent the last several years helping people make sense of body transformation data progress photos, tape measurements, weight trends through the Body Tracker app on iOS and Android. We built it because the standard tools (the scale, isolated measurements, before-and-after snapshots taken at different angles) consistently failed the people trying to track real body change honestly.
Everything in this guide is sourced to peer-reviewed research or official health guidance. The practical observations ("what we see," "in practice") come from what the Body Tracker team has watched play out in tens of thousands of real user timelines. If you want to put this guide into practice, Body Tracker is free to try for 14 days.
Sources
- CDC National Center for Health Statistics, "Mean Body Weight, Height, Waist Circumference, and Body Mass Index Among Adults: United States, 1999-2000 Through 2015-2016," National Health Statistics Reports No. 122, December 2018. https://www.cdc.gov/nchs/data/nhsr/nhsr122-508.pdf
- NICE guideline NG246, "Overweight and obesity management," January 2025. https://www.nice.org.uk/guidance/ng246
- Bovet, J. "Evolutionary Theories and Men's Preferences for Women's Waist-to-Hip Ratio: Which Hypotheses Remain? A Systematic Review." Frontiers in Psychology, 2019. https://www.frontiersin.org/journals/psychology/articles/10.3389/fpsyg.2019.01221
- Freese, J., & Meland, S. “Seven Tenths Incorrect: Heterogeneity and Change in the Waist-to-Hip Ratios of Playboy Centerfold Models and Miss America Pageant Winners.” Journal of Sex Research, 2002, 39(2), 133-138.https://www.icpsr.umich.edu/web/ICPSR/studies/1331/versions/V1
- Simmons, K., Istook, C. L., Devarajan, P. "Female Figure Identification Technique (FFIT) for Apparel," North Carolina State University / SizeUSA. Reported via Newswise: https://www.newswise.com/articles/fashion-designers-ignoring-shapes-of-womens-bodies